Introduction: The liquisolid technique presents a promising avenue for enhancing the dissolution rate and bioavailability of poorly water-soluble drugs like celecoxib. This study investigated the formulation and evaluation of celecoxib tablets using this technique. Aim: To formulate and evaluate celecoxib tablets using the liquisolid technique, with the objective of enhancing its dissolution rate and bioavailability. Methods: Celecoxib tablets were prepared using the liquid-solid technique by incorporating a non-volatile liquid medication carrier and a suitable solid carrier. Various formulations were developed by altering the ratios of drug, carrier, and coating materials. The prepared tablets were characterized for their physical properties, drug content uniformity, in vitro dissolution behavior, and compatibility using Fourier-transform infrared (FTIR) spectroscopy. Results: The solubility profile showed that the maximum rate of solubility was recorded in PEG-400 (11.03 ± 0.01) when compared to other non-volatile solvents. The angle of slide, indicated that the excipients used were within the acceptable limit of 33°. The FTIR spectroscopy showed compatibility of the drug and excipients. The results of the SEM showed that spherically-shaped vesicles were formed. Evaluation of the pre-compression parameters indicated that the drug content was highest in batch F-11 hence its optimization (96.1 ± 0.90). The post compression evaluation indicated that the official tests were within the acceptable range for disintegration time (2.25 ± 0.35). The results of the in vitro release studies of the optimized formulation, conventional tablet and reference commercial tablet showed that the amount of drug released increased steadily with time over the 1-hour period. Conclusion: Our findings underscore its viability as a strategy to enhance the therapeutic efficacy of poorly water-soluble drugs, offering promising prospects for pharmaceutical formulation.
| Published in | Pharmaceutical Science and Technology (Volume 8, Issue 2) |
| DOI | 10.11648/j.pst.20240802.12 |
| Page(s) | 24-46 |
| Creative Commons |
This is an Open Access article, distributed under the terms of the Creative Commons Attribution 4.0 International License (http://creativecommons.org/licenses/by/4.0/), which permits unrestricted use, distribution and reproduction in any medium or format, provided the original work is properly cited. |
| Copyright |
Copyright © The Author(s), 2024. Published by Science Publishing Group |
Liquisolid, Celecoxib, Carrier, Coating Material, Dissolution
Solvent/vehicle | Celecoxib |
|---|---|
Distilled water | 0.05 ± 0.01 |
Tween-80 | 11.03 ± 0.01 |
PEG 400 | 13.10 ± 0.36 |
Propylene glycol | 10.07 ± 0.02 |
Glycerin | 08.02 ± 0.33 |
Methanol | 4.11 ± 0.39 |
Glacial acetic acid | 2.08 ± 0.06 |
Buffer pH 7.4 | 2.01 ± 0.02 |
Buffer pH 6.8 | 2.10 ± 0.28 |
0.1N HCl. | 01.09 ± 0.35 |
Drug/excipient | Angle of slide (o) (mean ± SD) |
|---|---|
Maize starch | 33.0 ± 1.40 |
Lactose | 33.0 ± 0.00 |
Magnesium stearate | 33.0 ± 2.83 |
Microcrystalline cellulose | 32.0 ± 2.12 |
Celecoxib | 36.0 ± 0.71 |
Silicon dioxide (SiO2) | 33.5 ± 0.35 |
Pure drug/codes | Angle of repose (o) | Bulk density (g/ml) | Tapped density (g/ml) | Hausners Ratio | Compressibility index (%) |
|---|---|---|---|---|---|
Celecoxib | 27.22 ± 0.05 | 0.23 ± 0.01 | 0.30 ± 0.01 | 1.15 ± 0.01 | 21.32 ± 2.89 |
F-1 | 26.52 ± 0.79 | 0.24 ± 0.01 | 0.34 ± 0.03 | 1.17 ± 0.01 | 20.08 ± 2.11 |
F-2 | 24.12 ± 1.21 | 0.25 ± 0.01 | 0.25 ± 0.01 | 1.14 ± 0.02 | 20.51 ± 1.47 |
F-3 | 24.75 ± 1.44 | 0.25 ± 0.01 | 0.29 ± 0.01 | 1.18 ± 0.01 | 19.92 ± 1.83 |
F-4 | 25.85 ± 0.38 | 0.25 ± 0.01 | 0.26 ± 0.01 | 1.23 ± 0.01 | 19.82 ± 1.75 |
F-5 | 27.75 ± 1.09 | 0.23 ± 0.01 | 0.29 ± 0.01 | 1.17 ± 0.01 | 20.92 ± 0.41 |
F-6 | 24.92 ± 0.93 | 0.24 ± 0.01 | 0.34 ± 0.01 | 1.18 ± 0.03 | 19.31 ± 1.48 |
F-7 | 25.95 ± 0.45 | 0.23 ± 0.01 | 0.31 ± 0.01 | 1.18 ± 0.02 | 19.52 ± 0.76 |
F-8 | 25.72 ± 0.22 | 0.25 ± 0.01 | 0.28 ± 0.01 | 1.25 ± 0.01 | 19.96 ± 0.38 |
F-9 | 25.87 ± 1.25 | 0.25 ± 0.01 | 0.27 ± 0.01 | 1.26 ± 0.02 | 17.86 ± 1.01 |
F-10 | 24.57 ± 1.18 | 0.28 ± 0.02 | 0.27 ± 0.01 | 1.24 ± 0.01 | 19.79 ± 0.45 |
F-11 | 24.82 ± 0.44 | 0.27 ± 0.01 | 0.30 ± 0.01 | 1.24 ± 0.01 | 22.42 ± 2.72 |
F-12 | 26.72 ± 0.93 | 0.30 ± 0.01 | 0.35 ± 0.01 | 1.13 ± 0.01 | 14.04 ± 0.94 |
CT | 24.32 ± 0.38 | 0.24 ± 0.01 | 0.34 ± 0.01 | 1.27 ± 0.04 | 18.00 ± 0.36 |
Formulation code | Celecoxib |
|---|---|
F-1 | 97.1 ± 1.59 |
F-2 | 97.4 ± 0.07 |
F-3 | 96.9 ± 0.38 |
F-4 | 97.0 ± 0.15 |
F-5 | 96.7 ± 0.42 |
F-6 | 95.9 ± 0.65 |
F-7 | 96.3 ± 0.31 |
F-8 | 95.4 ± 0.65 |
F-9 | 96.9 ± 0.58 |
F-10 | 95.9 ± 0.40 |
F-11 | 96.1 ± 0.90 |
F-12 | 95.7 ± 0.74 |
CT | 95.7 ± 0.98 |
Formulation code | General appearance | Hardness (kg/cm2) | Thickness (mm) | Diameter (mm) | Weight variation (mg) | Friability (%) | Disintegration time (sec) |
|---|---|---|---|---|---|---|---|
F-1 | White | 5.15 ± 0.74 | 4.50 ± 0.28 | 5.31 ± 0.20 | 666.4 ± 3.95 | 0.61 ± 0.07 | 4.65 ± 0.10 |
F-2 | White | 4.90 ± 0.56 | 4.60 ± 0.21 | 5.15 ± 0.29 | 677.4 ± 1.62 | 0.59 ± 0.08 | 5.45 ± 0.17 |
F-3 | White | 4.60 ± 0.35 | 4.90 ± 0.00 | 4.95 ± 0.10 | 686.0 ± 2.86 | 0.66 ± 0.01 | 4.25 ± 0.10 |
F-4 | White | 4.55 ± 0.31 | 4.45 ± 0.24 | 4.80 ± 0.07 | 750.8 ± 2.68 | 0.47 ± 0.12 | 5.50 ± 0.28 |
F-5 | White | 4.55 ± 0.24 | 4.75 ± 0.03 | 4.96 ± 0.04 | 766.6 ± 1.83 | 0.55 ± 0.03 | 5.75 ± 0.24 |
F-6 | White | 4.50 ± 0.24 | 4.50 ± 0.14 | 4.46 ± 0.30 | 783.4 ± 0.31 | 0.55 ± 0.03 | 4.70 ± 0.14 |
F-7 | White | 4.55 ± 0.24 | 4.40 ± 0.21 | 4.50 ± 0.21 | 759.9 ± 0.63 | 0.62 ± 0.01 | 5.50 ± 0.28 |
F-8 | White | 4.65 ± 0.03 | 4.30 ± 0.28 | 4.60 ± 0.14 | 771.7 ± 2.61 | 0.60 ± 0.00 | 6.90 ± 0.21 |
F-9 | White | 4.75 ± 0.03 | 4.35 ± 0.17 | 4.95 ± 0.10 | 786.5 ± 2.51 | 0.61 ± 0.01 | 6.90 ± 0.14 |
F-10 | White | 4.70 ± 0.07 | 4.20 ± 0.21 | 4.80 ± 0.16 | 848.7 ± 4.03 | 0.59 ± 0.01 | 5.10 ± 0.07 |
F-11 | White | 4.70 ± 0.14 | 4.30 ± 0.07 | 4.72 ± 0.24 | 863.9 ± 3.46 | 0.45 ± 0.03 | 5.50 ± 0.28 |
F-12 | White | 4.70 ± 0.14 | 4.20 ± 0.07 | 4.55 ± 0.24 | 883.6 ± 0.28 | 0.50 ± 0.00 | 5.75 ± 0.10 |
CT | White | 4.50 ± 0.21 | 4.50 ± 0.21 | 4.45 ± 0.17 | 606.9 ± 2.75 | 0.50 ± 0.00 | 13.30 ± 0.14 |
RCT | White | 3.85 ± 0.60 | 3.85 ± 0.60 | 4.56 ± 0.32 | 4.00 ± 2.80 | 0.40 ± 0.00 | 12.40 ± 0.21 |
Formulation batch | Zero order | First order | Higuchi | Korsmeyer-Peppas | Hixson-Crowell | |
|---|---|---|---|---|---|---|
r2 | r2 | r2 | r2 | n | r2 | |
F-1 | 0.9153 | 0.9986 | 0.9696 | 0.9962 | 0.439 | 0.9970 |
F-2 | 0.9336 | 0.9971 | 0.9783 | 0.9893 | 0.413 | 0.9984 |
F-3 | 0.9274 | 0.9960 | 0.9760 | 0.9918 | 0.480 | 0.9913 |
F-4 | 0.9295 | 0.9896 | 0.9752 | 0.9852 | 0.517 | 0.9832 |
F-5 | 0.9578 | 0.9936 | 0.9894 | 0.9883 | 0.395 | 0.9933 |
F-6 | 0.9413 | 0.9964 | 0.9824 | 0.9785 | 0.407 | 0.9950 |
F-7 | 0.9400 | 0.9925 | 0.9803 | 0.9869 | 0.463 | 0.9886 |
F-8 | 0.9338 | 0.9968 | 0.9795 | 0.9934 | 0.463 | 0.9932 |
F-9 | 0.9232 | 0.9984 | 0.9736 | 0.9995 | 0.388 | 0.9984 |
F-10 | 0.9353 | 0.9916 | 0.9775 | 0.9890 | 0.449 | 0.9944 |
F-11 | 0.9301 | 0.9962 | 0.9764 | 0.9826 | 0.398 | 0.9944 |
F-12 | 0.9373 | 0.9950 | 0.9790 | 0.9786 | 0.443 | 0.9948 |
F-CT | 0.9191 | 0.9950 | 0.9671 | 0.9889 | 0.313 | 0.9857 |
RCT | 0.9208 | 0.9850 | 0.9732 | 0.9965 | 0.459 | 0.9731 |
Run (batch) | Independent Factors | Dependent factors | ||
|---|---|---|---|---|
Concentration of non-volatile solvent | Carrier: coat ratio (R) | Drug release (%) | Drug content (%) | |
1 | 100 | 5 | 84.70 ± 0.00 | 97.1 ± 1.59 |
2* | 100 | 5 | 86.60 ± 1.20 | 97.4 ± 0.07 |
3 | 100 | 5 | 82.25 ± 1.44 | 96.9 ± 0.38 |
4 | 200 | 5 | 81.55 ± 0.95 | 97.0 ± 0.15 |
5 | 200 | 5 | 83.35 ± 0.17 | 96.7 ± 0.42 |
6 | 200 | 5 | 83.90 ± 0.56 | 95.9 ± 0.65 |
7 | 300 | 5 | 81.65 ± 1.02 | 96.3 ± 0.31 |
8 | 300 | 5 | 83.30 ± 0.42 | 95.4 ± 0.65 |
9 | 300 | 5 | 85.35 ± 0.74 | 96.9 ± 0.58 |
10 | 400 | 5 | 82.25 ± 0.31 | 95.9 ± 0.40 |
11 | 400 | 5 | 83.70 ± 0.42 | 96.1 ± 0.90 |
12 | 400 | 5 | 84.40 ± 0.91 | 95.7 ± 0.74 |
Formulation code | Non-volatile liquid vehicle (mg) | R | Drug: liquid vehicle ratio | Active ingredients (mg) | Liquid vehicle (mg) | Lf | Carrier (mg) | Coating material (mg) | Starch (5%) | Mag. Stearate (1% total weight, mg) | Total weight (mg) |
|---|---|---|---|---|---|---|---|---|---|---|---|
F-2 | PEG-400 | 5 | 100 | 0.46 | 434.8 | 87.5 | 33.77 | 6.754 | 675.4 | ||
CT | ---- | ---- | ---- | 100 | ---- | ---- | 425.7 | 85.1 | 30.54 | 6.108 | 610.8 |
Pure drug/codes | Angle of repose (o) | Bulk density (g/ml) | Tapped density (g/ml) | Hausners Ratio | Compressibility index (%) |
|---|---|---|---|---|---|
F-2 | 22.10 ± 1.21 | 0.25 ± 0.01 | 0.25 ± 0.01 | 1.14 ± 0.02 | 20.17± 1.40 |
CT | 23.32 ± 0.35 | 0.22 ± 0.01 | 0.34 ± 0.01 | 1.27 ± 0.04 | 18.00 ± 0.36 |
Formulation code | General appearance | Hardness (kg/cm2) | Thickness (mm) | Diameter (mm) | Weight variation (mg) | Friability (%) | Disintegration time (sec) |
|---|---|---|---|---|---|---|---|
F-2 | White | 4.90 ± 0.56 | 4.60 ± 0.21 | 5.15 ± 0.29 | 677.40± 1.62 | 0.59 ± 0.08 | 5.45 ± 0.17 |
CT | White | 4.50 ± 0.21 | 4.50 ± 0.21 | 4.45 ± 0.17 | 606.90 ± 2.75 | 0.50 ± 0.00 | 13.30 ± 0.14 |
RCT | White | 3.85 ± 0.60 | 3.85 ± 0.60 | 4.56 ± 0.32 | 600.70 ± 2.80 | 0.40 ± 0.00 | 12.40 ± 0.21 |
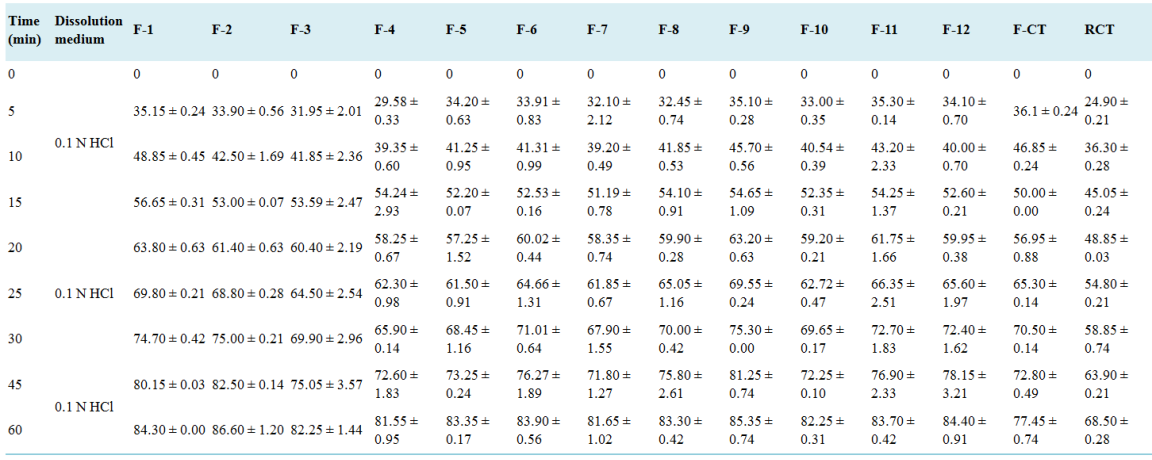
Time (min) | Dissolution medium | F-3 | F-CT | RCT |
|---|---|---|---|---|
0 | 0.1 N HCl | 0 | 0 | 0 |
5 | 34.2 ± 0.56 | 36.10 ± 0.42 | 24.90 ± 0.21 | |
10 | 44.0 ± 1.69 | 46.85 ± 0.24 | 36.30 ± 0.28 | |
15 | 56.0 ± 0.07 | 50.00 ± 0.01 | 45.05 ± 0.24 | |
20 | 63.0 ± 0.63 | 56.95 ± 0.88 | 48.85 ± 0.03 | |
25 | 69.0 ± 0.28 | 65.30 ± 0.14 | 54.80 ± 0.21 | |
30 | 74.0 ± 0.21 | 68.50 ± 0.14 | 58.85 ± 0.74 | |
45 | 83.0 ± 0.14 | 70.30 ± 0.41 | 62.90 ± 0.21 | |
60 | 88.4 ± 1.20 | 76.40 ±0.74 | 65.60 ± 0.28 |
FTIR | Fourier Transform Infra-Red |
SEM | Scanning Electron Microscopy |
PEG | Polyethylene Glycol |
KBR | Potassium Bromide |
| [1] | Modi A, Tayade P. (2006). Enhancement of Dissolution Profile by Solid Dispersion (Kneading) Technique. AAPS Pharm Sci Tech 7(3): Article. |
| [2] | Allen, T. M. and Cullis, P. R., (2004). Drug delivery systems: entering the mainstream. Science, 303(5665), pp. 1818-1822. |
| [3] | Amidon, G. L., Lennernäs, H., Shah, V. P. and Crison, J. R., (1995). A theoretical basis for a biopharmaceutic drug classification: the correlation of in vitro drug product dissolution and in vivo bioavailability. Pharmaceutical research, 12(3), pp. 413-420. |
| [4] | Badawy, M. A., Kamel, A. O. and Sammour, O. A., (2016). Use of biorelevant media for assessment of a poorly soluble weakly basic drug in the form of liquisolid compacts: in vitro and in vivo study. Drug delivery, 23(3), pp. 808-817. |
| [5] | Chuahan PV, Patel HK, Patel BA, Patel KN, Patel PA (2012). Liquisolid technique for enhancement of dissolution rate of ibuprofen. International Journal for Pharmaceutical Research Scholars. 1 (1): 268-280. |
| [6] | Farheen F, Sharma G, Rathore A, Sharma N. (2015). Liquisolid technology: A review. World Journal of Pharmacy and Pharmaceutical Sciences, 2(3): 947-958. |
| [7] | Badve, S. S., Sher, P., Korde, A., Pawar, A. P. (2007). Development of hollow/porous calcium pectinate beads for floating-pulsatile drug delivery. European Journal Pharmaceutical Biopharmacy, 65: 85–93. |
| [8] | Kaur M, Bala R, Arora S. (2013). Liquisolid technology: A review. An International Journal of Advances in Pharmaceutical Sciences 4(1): 1-15. |
| [9] | McCormack PL (2011). "Celecoxib: a review of its use for symptomatic relief in the treatment of osteoarthritis, rheumatoid arthritis and ankylosing spondylitis". Drugs. 71 (18): 2457–89. |
| [10] | Bettini, R., Catellani, P. L., Santi, P., Massimo, G., Peppas, N. A. and Colombo, P., (2001). Translocation of drug particles in HPMC matrix gel layer: effect of drug solubility and influence on release rate. Journal of Controlled Release, 70(3), pp. 383-391. |
| [11] | Dorozynski R., Jachowicz P., Kulinowaski S., Kwiecinski, Szybinski K., Skora T. (2004). The macromolecular polymers for the preparation of hydrodynamic ally balanced system-methods of evaluation. Drug Dev Int Pharm 30(9): 947-957. |
| [12] | Hoffman A., David S., Eran L., Sara R., Eytan K., ichael F. (2004). Pharmacokinetic and pharmacodynamic aspects of gastro retentive dosage forms. Int J Pharm. 277: 141-153. |
| [13] |
National Institute for Health and Care Excellence (NICE). Non-steroidal anti-inflammatory drugs. Manchester: NICE; 2013. Available from:
www.nice.org.uk (Accessed Sep, 2013). |
| [14] | Sahil M G, Sharad S P, Shirish V S, Kisan R J, Vilasrao J K, (2018). Liquisolid Compact: A New Technique for Enhancement of Drug Dissolution. International Journal of Research in Pharmacy and Chemistry; 3(1): 705-715. |
| [15] | Syed I, Pavani E. (2012). A Review on The Liquisolid Technique Based Drug Delivery System. International Journal of Pharmaceutical Sciences and Drug Research, 4(2): 88-96. |
| [16] | Beignon, M., Bohic, S., Le Guennec, M., Le Goff D., Roger P. and Proutire, A., (1998). Molecular weight determination of macromolecules with a new simplified and coherent light scattering method. J Mol Struct, 443(1–3), pp. 233–53. |
| [17] | ASTM_International (2013) ASTM B213-13: standard test methods for flow rate of metal powders using the hall flowmeter funnel. ASTM_International, West Conshohocken, PA. |
| [18] | Utsav S P, Khushbu C P. (2018) Liquisolid Technique for Poorly Soluble Drugs. Journal of Science and Innovative Research; 2(1): 145-159. |
| [19] | Ankit, B., Rathore, R. P. S., Tanwar, Y. S., Gupta, S. and Bhaduka, G., (2013). Oral sustained release dosage form: an opportunity to prolong the release of drug. IJARPB, 3(1), pp. 7-14. |
| [20] | Akinlade, B., Elkordy, A. A., Essa, E. A. and Elhagar, S., (2010). Liquisolid systems to improve the dissolution of furosemide. Scientia pharmaceutica, 78(2), p. 325. |
| [21] | Asare-Addo, K., Conway, B. R., Hajamohaideen, M. J., Kaialy, W., Nokhodchi, A., Larhrib, H., (2013). Aqueous and hydro-alcoholic media effects on polyols. Colloids Surfaces B Biointerfaces, 11(1), pp 9–24. |
| [22] | Alireza H, Fatemeh S, Ali N, Jaleh V, Hadi A. (2015). Preparation and characterization of celecoxib dispersions in Soluplus: comparison of spray drying and conventional methods. Iranian Journal of Pharmaceutical Research. 14 (1): 33-50. |
| [23] | Armstrong NA. (2006). Tablet manufacture. In: Swarbrick J, Boylan JC, editors. Encyclopedia of pharmaceutical technology. 3rd ed. New York: Marcel Dekker. |
| [24] | Gulshan Md, Lakshmi Swapna Sai M, Rajesh J, Rama Rao N. (2016). A novel formulation of celecoxib in the treatment of familial adenomatous polyposis. J Global Trends Pharm Sci 7: 3004-8. |
| [25] | Ning J, Shu M, Ming G, Jie F, Run C. (2011). Synthesis and characterization of cellulose-silica composite fiber in ethanol/water mixed solvents. Bioresources 1186-1195. |
| [26] | Saravanan S, Dubey R. (2020). Synthesis of SiO2 nanoparticles by Sol-Gel method and their optical and structural properties. Romanian Journal of Information Science and Technology. 23; 1: 105-112. |
| [27] | Abdullah A, Chalimah S, Primadone I, Hanantyo M. (2018). Physical and chemical properties of corn, cassava and potato starches. Earth and Environmental Science. 160; 012-30. |
| [28] | Sue Haupt, Tamar Zioni, Irith Gtai, Jackie kleinstern, Abraham Rubinstein (2006). Luminal delivery and dosing considerations of local celecoxib administration to colorectal cancer. Eur J Pharm Sci; 28: 204-11. |
| [29] | ASTM_International (2014) ASTM F3049-14: Standard guide for characterizing properties of metal powders used for additive manufacturing processes. ASTM_International, West Conshohocken, PA. |
| [30] | Blagden, N., de Matas, M., Gavan, P. T. and York, P., (2007). Crystal engineering of active pharmaceutical ingredients to improve solubility and dissolution rates. Adv Drug Deliv Rev, 59(7), pp. 617–30. |
| [31] | Nafiseh MN, Javad S, Nasimi N, Ali RZ, Matthew L, Yousef J (2022). Combining liquisolid and co-grinding techniques to enhance the dissolution rate of celecoxib. Journal of Pharmaceutical Innovation. |
| [32] | Baveja, S. K., Ranga Rao, K. V., Padmalatha, Devi, K., (1987). Zero-order release hydrophilic matrix tablets of adrenergic blockers. Int J Pharm, 39(1–2), 39–45. |
APA Style
Andrew, E. C., Chidera, A. C., Ekemezie, O. J., Pauline, O. N., Ezegbe, A. G., et al. (2024). Formulation and in vitro Evaluation of Liquisolid Compact of Celecoxib. Pharmaceutical Science and Technology, 8(2), 24-46. https://doi.org/10.11648/j.pst.20240802.12
ACS Style
Andrew, E. C.; Chidera, A. C.; Ekemezie, O. J.; Pauline, O. N.; Ezegbe, A. G., et al. Formulation and in vitro Evaluation of Liquisolid Compact of Celecoxib. Pharm. Sci. Technol. 2024, 8(2), 24-46. doi: 10.11648/j.pst.20240802.12
@article{10.11648/j.pst.20240802.12,
  author = {Ezegbe Chekwube Andrew and Anikwe Celestine Chidera and Okorie James Ekemezie and Okafor Nnedimma Pauline and Amarachi Grace Ezegbe and Nwankwo Emmanuel Chinedu and Okorafor Ezinne Chinemerem},
  title = {Formulation and in vitro Evaluation of Liquisolid Compact of Celecoxib
},
  journal = {Pharmaceutical Science and Technology},
  volume = {8},
  number = {2},
  pages = {24-46},
  doi = {10.11648/j.pst.20240802.12},
  url = {https://doi.org/10.11648/j.pst.20240802.12},
  eprint = {https://article.sciencepublishinggroup.com/pdf/10.11648.j.pst.20240802.12},
  abstract = {Introduction: The liquisolid technique presents a promising avenue for enhancing the dissolution rate and bioavailability of poorly water-soluble drugs like celecoxib. This study investigated the formulation and evaluation of celecoxib tablets using this technique. Aim: To formulate and evaluate celecoxib tablets using the liquisolid technique, with the objective of enhancing its dissolution rate and bioavailability. Methods: Celecoxib tablets were prepared using the liquid-solid technique by incorporating a non-volatile liquid medication carrier and a suitable solid carrier. Various formulations were developed by altering the ratios of drug, carrier, and coating materials. The prepared tablets were characterized for their physical properties, drug content uniformity, in vitro dissolution behavior, and compatibility using Fourier-transform infrared (FTIR) spectroscopy. Results: The solubility profile showed that the maximum rate of solubility was recorded in PEG-400 (11.03 ± 0.01) when compared to other non-volatile solvents. The angle of slide, indicated that the excipients used were within the acceptable limit of 33°. The FTIR spectroscopy showed compatibility of the drug and excipients. The results of the SEM showed that spherically-shaped vesicles were formed. Evaluation of the pre-compression parameters indicated that the drug content was highest in batch F-11 hence its optimization (96.1 ± 0.90). The post compression evaluation indicated that the official tests were within the acceptable range for disintegration time (2.25 ± 0.35). The results of the in vitro release studies of the optimized formulation, conventional tablet and reference commercial tablet showed that the amount of drug released increased steadily with time over the 1-hour period. Conclusion: Our findings underscore its viability as a strategy to enhance the therapeutic efficacy of poorly water-soluble drugs, offering promising prospects for pharmaceutical formulation.
},
 year = {2024}
}
TY  - JOUR
T1  - Formulation and in vitro Evaluation of Liquisolid Compact of Celecoxib

AU  - Ezegbe Chekwube Andrew
AU  - Anikwe Celestine Chidera
AU  - Okorie James Ekemezie
AU  - Okafor Nnedimma Pauline
AU  - Amarachi Grace Ezegbe
AU  - Nwankwo Emmanuel Chinedu
AU  - Okorafor Ezinne Chinemerem
Y1  - 2024/09/20
PY  - 2024
N1  - https://doi.org/10.11648/j.pst.20240802.12
DO  - 10.11648/j.pst.20240802.12
T2  - Pharmaceutical Science and Technology
JF  - Pharmaceutical Science and Technology
JO  - Pharmaceutical Science and Technology
SP  - 24
EP  - 46
PB  - Science Publishing Group
SN  - 2640-4540
UR  - https://doi.org/10.11648/j.pst.20240802.12
AB  - Introduction: The liquisolid technique presents a promising avenue for enhancing the dissolution rate and bioavailability of poorly water-soluble drugs like celecoxib. This study investigated the formulation and evaluation of celecoxib tablets using this technique. Aim: To formulate and evaluate celecoxib tablets using the liquisolid technique, with the objective of enhancing its dissolution rate and bioavailability. Methods: Celecoxib tablets were prepared using the liquid-solid technique by incorporating a non-volatile liquid medication carrier and a suitable solid carrier. Various formulations were developed by altering the ratios of drug, carrier, and coating materials. The prepared tablets were characterized for their physical properties, drug content uniformity, in vitro dissolution behavior, and compatibility using Fourier-transform infrared (FTIR) spectroscopy. Results: The solubility profile showed that the maximum rate of solubility was recorded in PEG-400 (11.03 ± 0.01) when compared to other non-volatile solvents. The angle of slide, indicated that the excipients used were within the acceptable limit of 33°. The FTIR spectroscopy showed compatibility of the drug and excipients. The results of the SEM showed that spherically-shaped vesicles were formed. Evaluation of the pre-compression parameters indicated that the drug content was highest in batch F-11 hence its optimization (96.1 ± 0.90). The post compression evaluation indicated that the official tests were within the acceptable range for disintegration time (2.25 ± 0.35). The results of the in vitro release studies of the optimized formulation, conventional tablet and reference commercial tablet showed that the amount of drug released increased steadily with time over the 1-hour period. Conclusion: Our findings underscore its viability as a strategy to enhance the therapeutic efficacy of poorly water-soluble drugs, offering promising prospects for pharmaceutical formulation.

VL  - 8
IS  - 2
ER  -
Department of Pharmaceutical Technology and Industrial Pharmacy, University of Nigeia, Nsukka, Nigeria
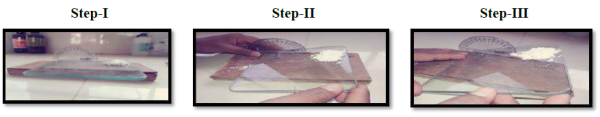
Figure 1. Angle of slide measurement.
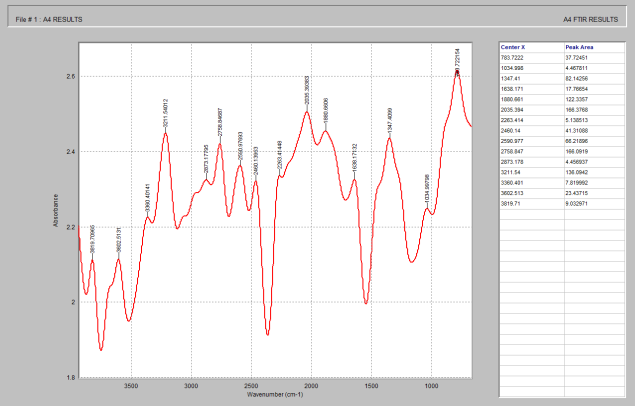
Figure 2. FTIR spectrum of Celecoxib.
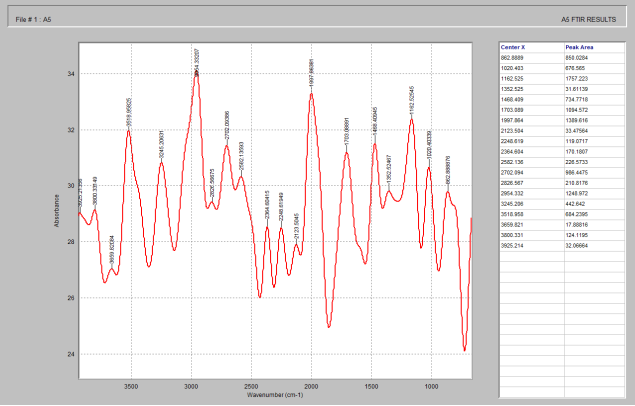
Figure 3. FTIR of microcrystalline cellulose.
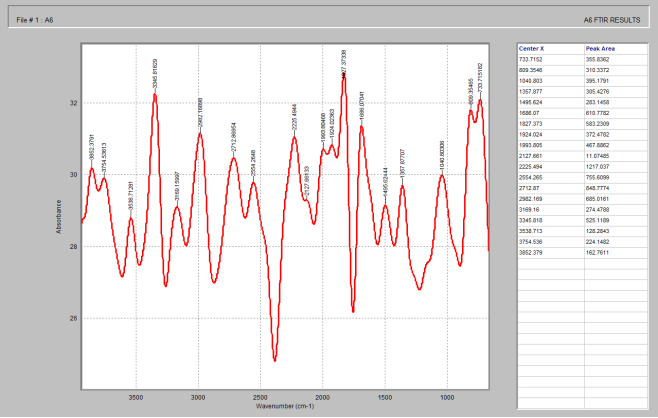
Figure 4. FTIR spectrum of silicon dioxide.

Figure 5. FTIR spectrum of starch.
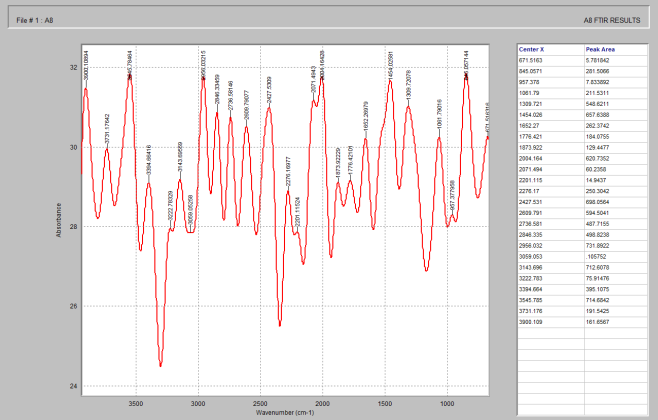
Figure 6. FTIR spectrum of magnesium stearate.
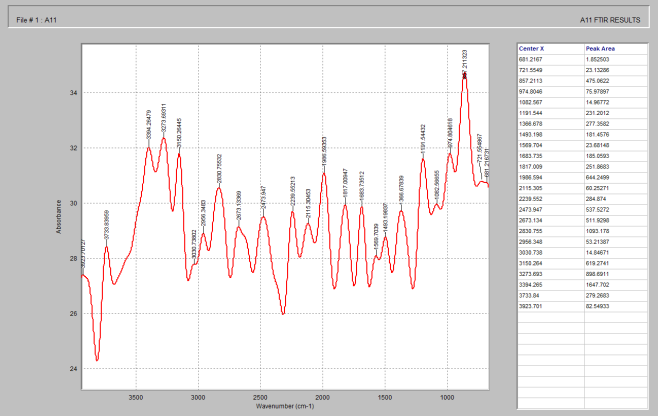
Figure 7. FTIR spectrum of celecoxib + MCC + starch + magnesium stearate + silicon dioxide.
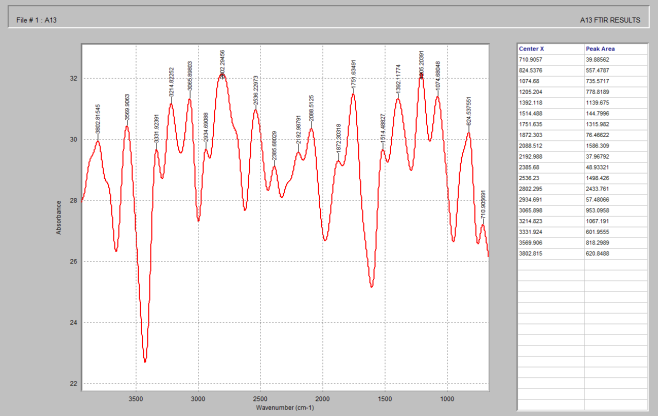
Figure 8. FTIR spectrum of Tween 80.
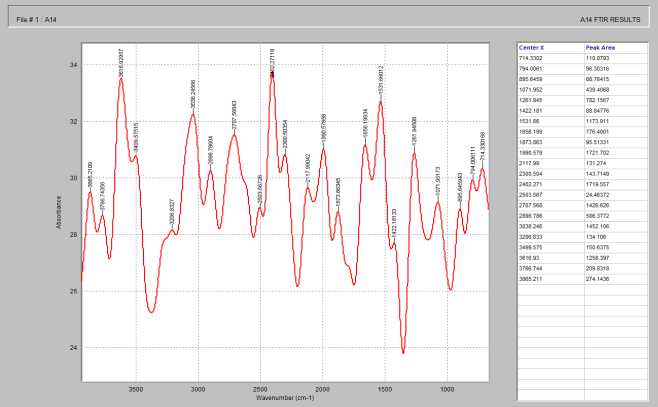
Figure 9. FTIR spectrum of PEG 4000.
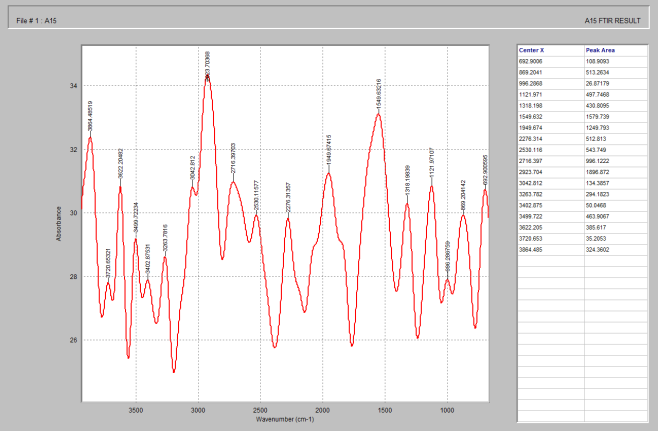
Figure 10. FTIR spectrum of lactose.
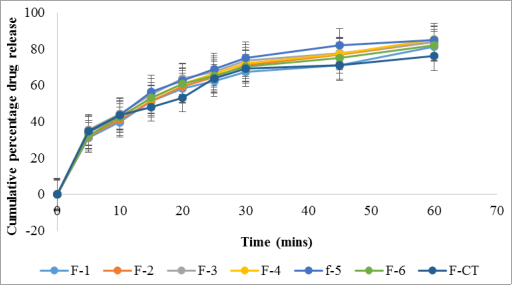
Figure 11. Drug release profile of batches F1 to F-6 and F-CT in 0.1 N HCl.
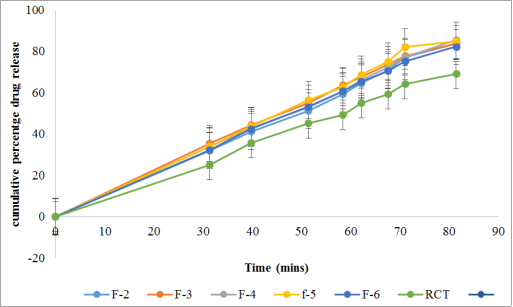
Figure 12. Drug release profile of batches F1 to F6 and R-CT in 0.1 N HCl.
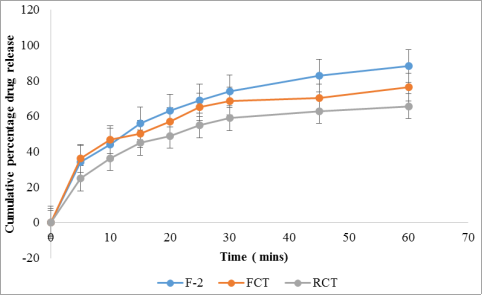
Figure 13. Cumulative percentage drug release of optimized batch (F-3), conventional tablet and reference commercial.
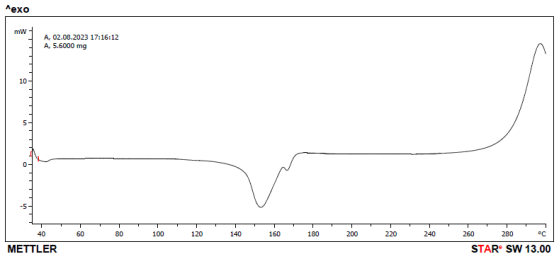
Figure 14. DSC thermogram of Celecoxib.
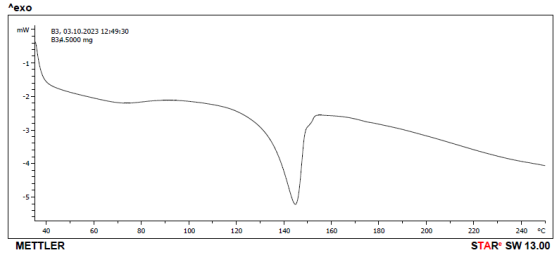
Figure 15. DSC thermogram of Celecoxib and lactose.
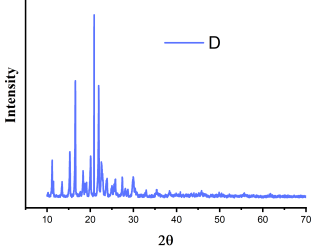
Figure 16. XRD of celecoxib.
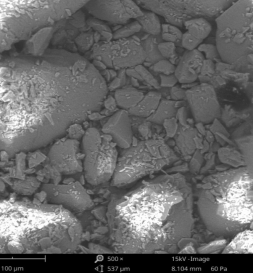
Figure 17. SEM photograph of optimized formulation of celecoxib.